
Guide Created September 2022
Get a complete, visual view of how your Google Ads campaigns are performing — all in one place. Our Google Ads Analytics Dashboard is designed to bring your key metrics together into a user-friendly interface so you can easily understand impressions, clicks, costs, conversions and trends without data overload. By linking Google Ads with analytics data, you’ll see exactly what’s working, what needs attention and where you have opportunities to improve ROI and grow conversions. With real-time visibility and simple reporting, making data-driven decisions has never been easier.
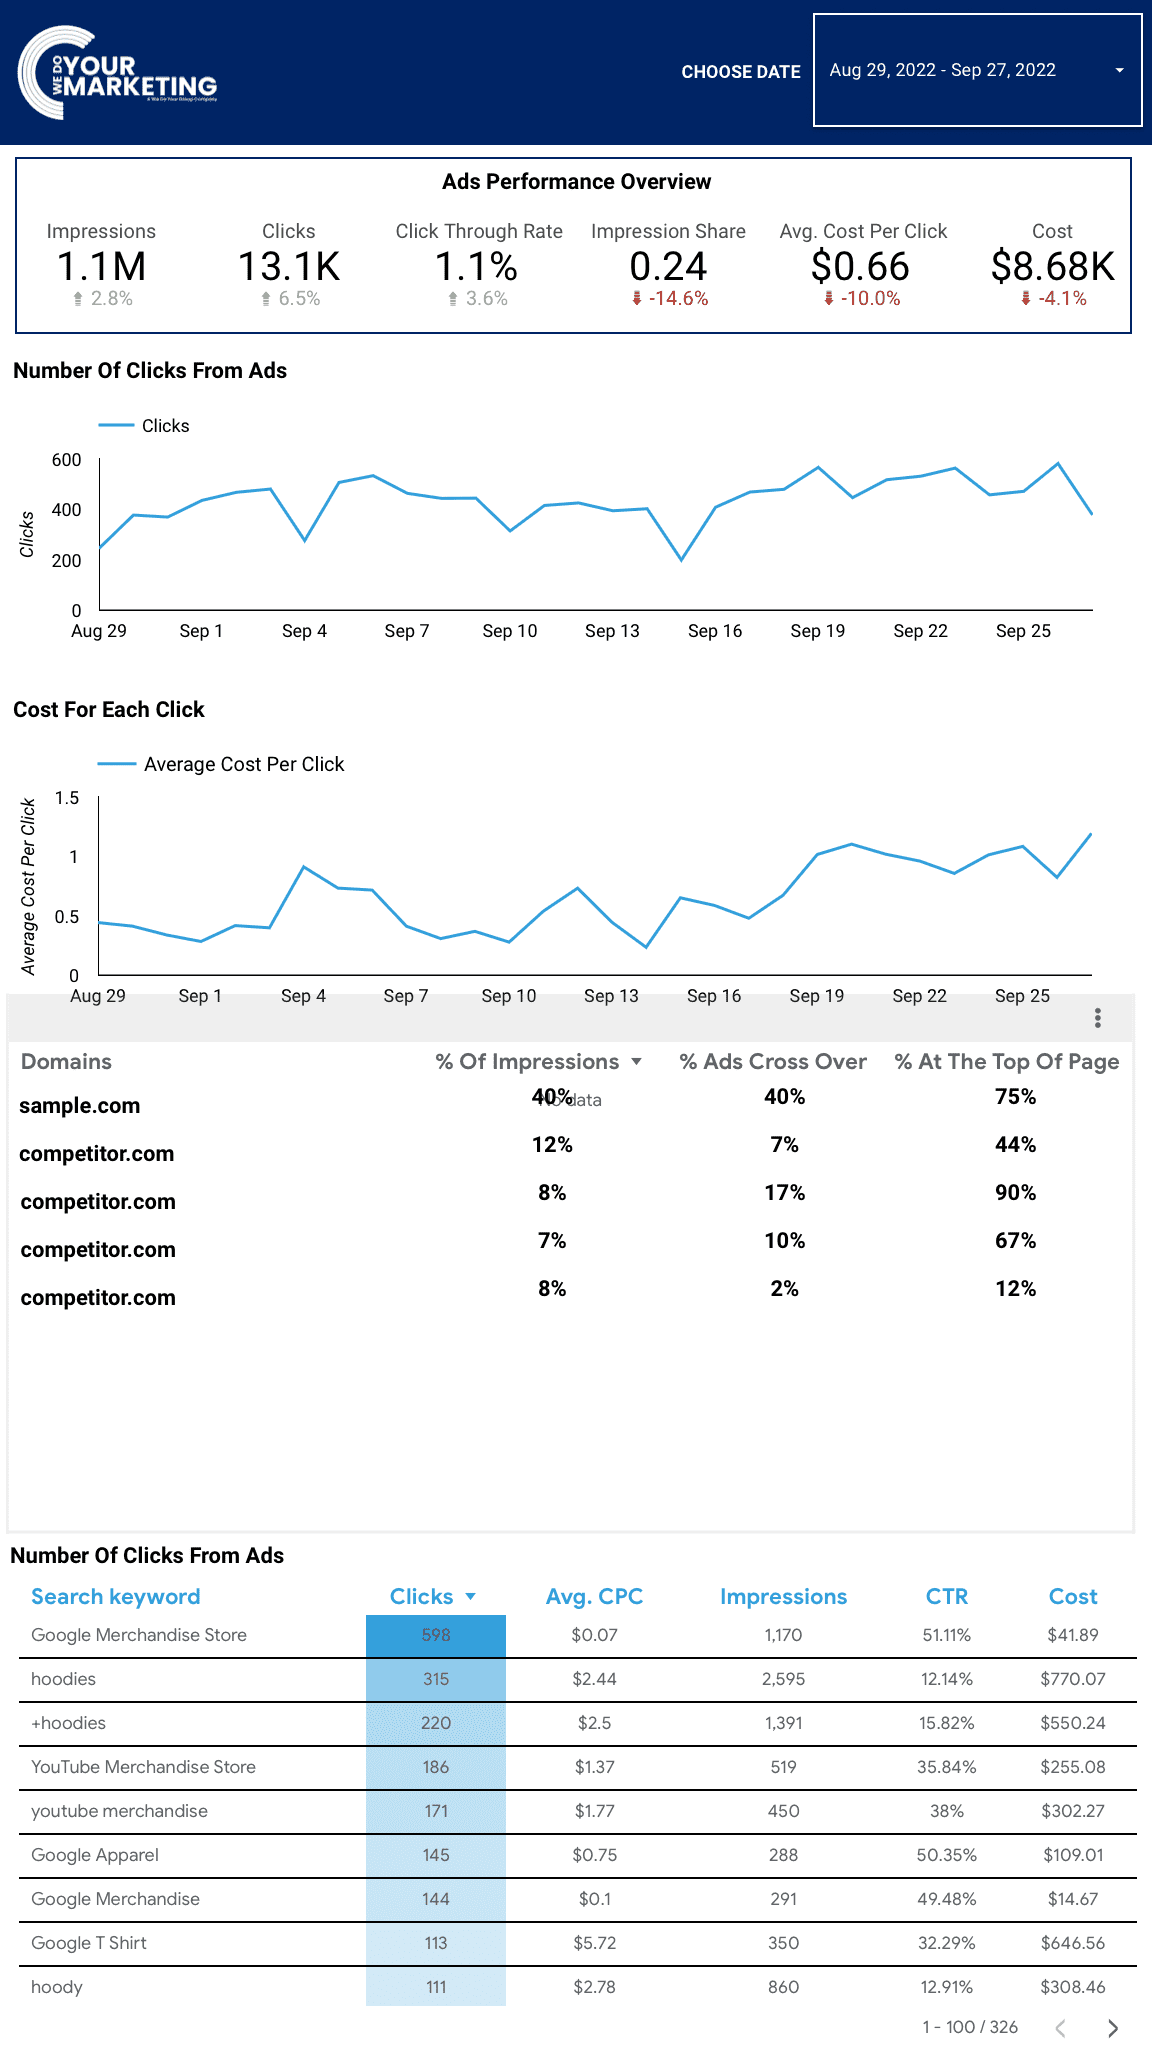
Ads Dashboard
Your Google Ads Dashboard brings your campaign performance into one place so you can easily see what’s happening and make smarter decisions about your advertising.
It gives you a visual overview of key metrics and trends so you don’t have to sift through raw data or multiple reports — everything you need to understand your campaign’s activity is laid out clearly for you.
Why Use a Dashboard instead of Google analytics
Using a dedicated analytics dashboard makes understanding your marketing performance far easier than working directly inside Google Analytics. Instead of navigating complex menus, reports and technical metrics, everything you need is presented clearly in one place — with visual charts, simple summaries and the most relevant data highlighted for you. An all-in-one dashboard removes noise and confusion, helping you quickly see what’s working, spot issues early and make confident decisions without needing specialist analytics knowledge or spending hours digging through raw data.
Choose Date
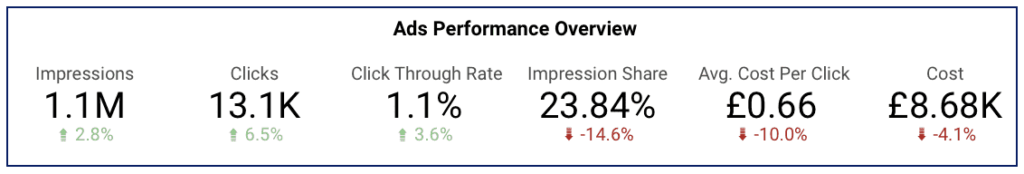
These stats allow you to see the following in clear numbers.
These numbers are based on the timescales within the top right and are compared to the previous period.
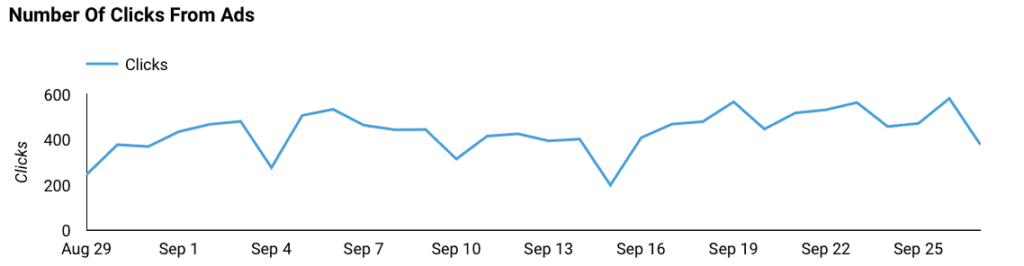
This is the graph of the number of people who have clicked on the ad and visited the landing pages within the time period set in the top right.
This is useful for understanding traffic patterns within the data. For example, less clicks on the weekend because there are fewer shoppers.
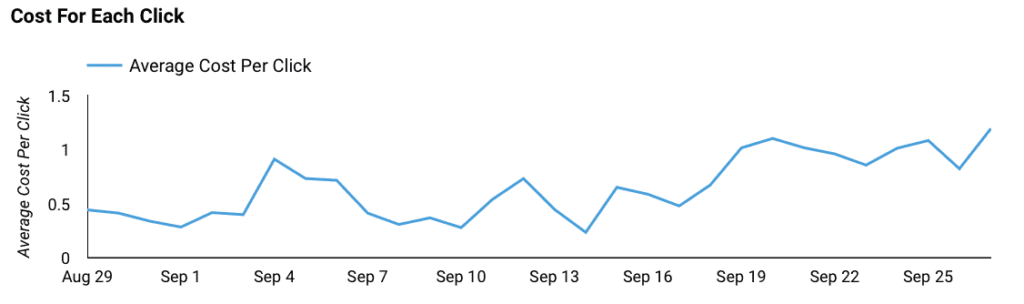
This is the graph of how much each click is costing you day by day within the time period set in the top right.
This should help you to see whether the ad is performing well or not.
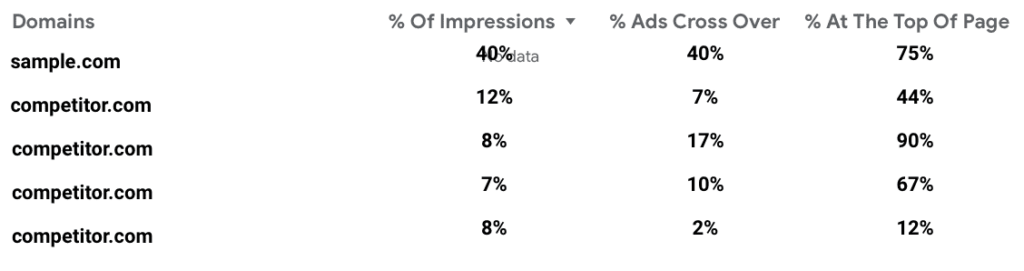
VS Competitors
This table will allow you to see how your website compares to your competitors within the same subset of keywords you are targetting within the time period set in the top right.
Being able to see how well your ads are doing vs your competitors will allow you to benchmark your ads.
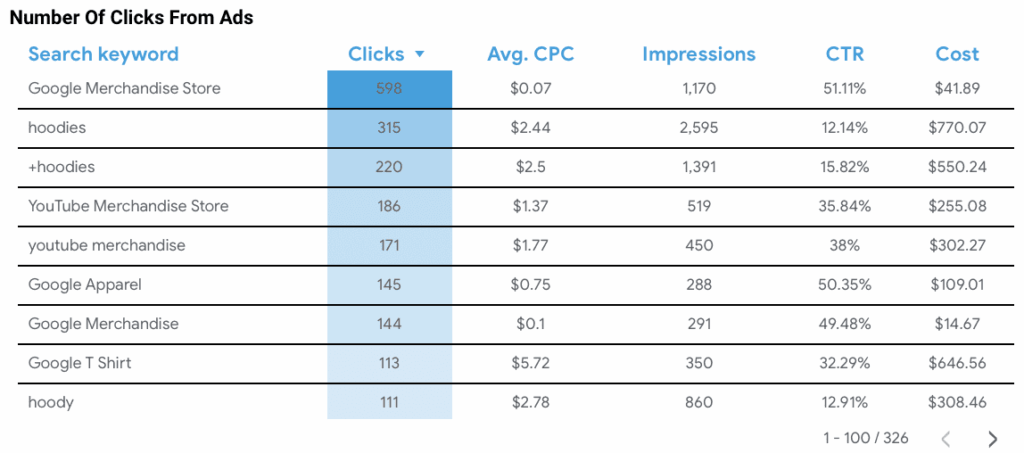
Number Of Clicks From Ads (Granular)
This data table allows you to see the individual performance of each keyword.
These numbers are dependant on the timescales set within the top right.
This website uses cookies to improve your experience. Choose what you're happy with.
Required for the site to function and can't be switched off.
Help us improve the website. Turn on if you agree.
Used for ads and personalisation. Turn on if you agree.